
Proportional Seat Distribution
Seriously, HOW does it work?
The Technical Details
For many people, the basics of Proportional Seat Distribution (PSD) are enough to satisfy any curiosity they have for how it works, and that's fine. Others want to know all the intricate details, and that's fine too! For those in the second group, this section dives into the nitty-gritty bits of how PSD does what it does, from allowing independent candidates to get seats and calculating seats for each party, to measuring candidates' success, comparing success between parties and ensuring PSD generates conclusive and complete results, even in odd situations.
As you look through the details of PSD, bear in mind that each detail exists to perform a specific task. It is these details that ensure PSD achieves the ambitious goals it was intentionally designed for: to take in raw voter data and provide maximally proportional results, to keep the process simple for voters, and to be ready to implement immediately without the need for changing district boundaries or using top-up representatives. Yes, there are calculations involved and, yes, if there are many candidates, there will be many calculations. Luckily, simple software can perform all calculations with ease in a matter of seconds.
To help you understand these details, we give an example of PSD in action: we apply the system to the vote results from Prince Edward Island (P.E.I.), a province of Canada, for the 2015 Canada federal election.
In a proportional voting system, political parties need an appreciable portion of all votes to earn a seat. Independent candidates only run in a single district and so cannot be expected to get a sizeable share of the popular vote. So, while seats for parties are determined by their share of the total vote across all districts, independent candidates are assessed based on their performance in their one district.
If confined to a single district, PSD always results in the candidate with more votes than the rest receiving the seat. So, if an independent candidate gets more votes than any other in the district, she gets the district's seat, otherwise the district is represented by a party candidate.
Let's take a look at the votes cast in the province of P.E.I. in the 2015 Canada federal election.
You can see that in all four of P.E.I.'s districts, no independent candidates ran. We can imagine, however, what would happen if a Jane Smith ran in Cardigan. In the PSD system, if she got fewer votes than some other candidate (5000 votes, for example) in the district then she would not get the seat for Cardigan, but more votes than the other candidates (15000, for example) and she would get the seat and the remaining three seats would be distributed to party candidates.

Independent Candidates
Counting Parties' Seats ... The Scenic Route
There are two different, but equivalent, ways to get the number of seats for each party (both calculate results using something called the Webster/ Sainte-Laguë method of highest averages). We’ll first go over the method that better shows the reasoning for PSD’s approach before seeing how the second method gives a shortcut to the exact same results (feel free to just skip to the second method if you want).
All districts not represented by an independent candidate go to party candidates. The following steps determine how many seats each party gets with PSD.
1) Subtract seats won by independent candidates (if any) from the total number of seats. This gives the remaining seats that will be distributed among the parties.
2) Multiply each party's proportion of the total votes by the number of remaining seats. This gives the ideal seat count for each party.
3) It is not possible to give a party a fraction of a seat and, unfortunately, each party's ideal seat count is a decimal number. So, round each ideal seat count down to get the minimum seat count for each party.
4) The minimum seat count underrepresents each party to some extent. To calculate how undervalued a party is by its minimum seat count, divide its minimum seat count by its ideal seat count and subtract 1. The result is a number between -100% and 0%: closer to -100% means the party is more undervalued by its minimum seat count and closer to 0% means it is less undervalued.
5) Because the ideal seat count for each party has been rounded down, there are a few seats left to distribute among the parties. Subtract every party's minimum seat count from the remaining seats (calculated in step 1) to get the number of additional seats.
6) Unfortunately, giving an additional seat to a party means the party is over-represented. To calculate how overvalued a party would be with an additional seat, add 1 to the party's minimum seat count, divide the result by its ideal seat count and then subtract 1. The result is a number above 0% where the larger the value is, the more overvalued the party would be with an additional seat.
7) Add each party's measure for undervaluation and overvaluation together to determine whether a party is more underrepresented by its minimum seat count or more overrepresented by an additional seat. The result is the party's under-/overvaluation a number above -100%, where any negative number means the party is more underrepresented by its minimum seat count than it would be overrepresented by an additional seat and a positive number means the party would be more overrepresented by an additional seat than it is underrepresented by its minimum seat count. That is, the smaller the value, the more deserving the party is of an additional seat.
8) It is possible that a party can get more than 1 of the additional seats. To determine how over-represented a party would be from multiple additional seats, add the number of extra seats being considered to the party's minimum seat count, divide the result by its ideal seat count and then subtract 1. The result is a number above 0% where the larger the value is, the more overvalued the party would be with the additional seats.
9) Every party's overvaluation values for multiple additional seats and their under-/overvaluation values can be compared: the lowest values indicate the associated party gets an additional seat.
10) Add together each party's minimum seat count with their additional seats, if any, and you get their final seat counts.
These steps guarantee that underrepresentation and overrepresentation of each party in the elected body are as small as physically possible. This is how PSD maximizes the proportionality of its results.
Let's see how seat count is determined for each party in the P.E.I. districts in the 2015 Canada federal election.
1) Because there are no independent candidates, all four seats in P.E.I. will be distributed among the parties.
2)
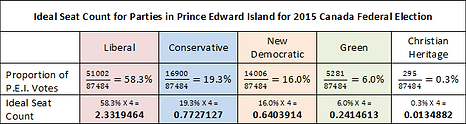
Ideally, the Liberal, Conservative, New Democratic, Green and Christian Heritage parties should get 2.3319464, 0.7727127, 0.6403914, 0.2414613 and 0.0134882 seats, respectively.
3) Rounding down their ideal seat counts, the Liberal, Conservative, New Democratic, Green and Christian Heritage parties get a minimum seat count of 2, 0, 0, 0 and 0 respectively.
4)
The minimum seat count for the Liberal, Conservative, New Democratic, Green and Christian Heritage parties underrepresents them by -14.2%, -100.0%, -100.0%, -100.0% and -100.0% respectively.
5) There were initially 4 seats remaining for parties and the minimum seat count accounts for 2 of them. This leaves 2 additional seats (4 - 2 = 2) to be given to party candidates.
6)
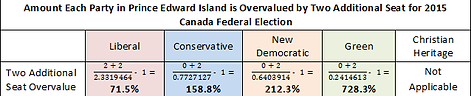
With one additional seat the Liberal, Conservative, New Democratic, Green and Christian Heritage parties would be overrepresented by 28.6%, 29.4%, 56.2%, 314.1% and 7313.9% respectively.
7)
The Conservative and New Democratic parties are more underrepresented by their minimum seat count than overrepresented by an additional seat, by -70.6% and -43.8% respectively. The Liberal, Green and Christian Heritage parties would be more overrepresented by an additional than they are underrepresented by their minimum seat count, by 14.4%, 214.1% and 7213.9% respectively.
8)
A second additional seat overrepresents the Liberal, Conservative, New Democratic and Green parties by 71.5%, 158.8%, 212.3% and 728.3% respectively. The Christian Heritage party only ran in a single district and so could not get a second additional seat in P.E.I.. Because there are only 2 additional seats to be distributed in P.E.I., there is no need to consider how overrepresented a party would be by three or more additional seats.
9)
Because the Conservative and New Democratic parties are the most underrepresented/least overrepresented they get an additional seat each. Note that, the Liberal party would get the third and fourth additional seats if there were any.
10)
The final seat count for the Liberal, Conservative, New Democratic, Green and Christian Heritage parties is 2, 1, 1, 0 and 0 respectively.


Counting Parties' Seats ... The Short Cut
Here’s a quicker way to find out the number of seats for each party. This method also minimizes party underrepresentation and overrepresentation.
1) Subtract seats won by independent candidates (if any) from the total number of seats. This gives the remaining seats that will be distributed among the parties.
2) Multiply each party's proportion of the total votes by the number of remaining seats. This gives the ideal seat count for each party.
3) Round each ideal seat count to the nearest whole number. This gives the rounded seat count.
4) Subtract every party’s rounded seat count from the remaining seats (calculated in step 1). If the result is zero then the rounded seat count is the final seat count and it’s done! Otherwise…
5) Multiply each party’s original ideal seat count from step 2 by a positive constant (if the result from step 4 is bigger than zero, the constant is bigger than one; if less than zero, the constant is less than one). This gives the modified ideal seat count.
6) Round each modified ideal seat count to the nearest whole number. This gives a new rounded seat count.
7) Subtract every party’s new rounded seat count from the remaining seats (calculated in step 1). If the result is zero then the new rounded seat count is the final seat count and it’s done! Otherwise…
8) Repeat steps 5 to 7 with a different constant (if the result from step 7 was bigger than zero, the next constant must be larger; if less than zero, the next constant must be smaller).
While a good value for the constant is not initially obvious, it can be found with some trial and error (and very easily found with a simple computer program). These steps guarantee that underrepresentation and overrepresentation of each party in the elected body are as small as physically possible.
Let's see how seat count for each party in the P.E.I. districts in the 2015 Canada federal election can be determined using a modifying constant.
1) Because there are no independent candidates, all four seats in P.E.I. will be distributed among the parties.
2)
Ideally, the Liberal, Conservative, New Democratic, Green and Christian Heritage parties should get 2.3319464, 0.7727127, 0.6403914, 0.2414613 and 0.0134882 seats, respectively.
3) Rounding their ideal seat counts to the nearest whole number, the Liberal, Conservative, New Democratic, Green and Christian Heritage parties get a rounded seat count of 2, 1, 1, 0 and 0, respectively.
4) There were initially four seats remaining for parties and the rounded seat count accounts for all four of them, so the rounded seat counts are the final seat count. It’s done, and the result is the same as what we found with the previous method!
4*) That was easy! Actually, that was too easy. To show how this method works when things are a bit less convenient, let’s consider a made-up situation where the ideal seat count is 1.49, 1.16, 0.97, 0.36 and 0.02 for the Liberal, Conservative, New Democratic, Green and Christian Heritage parties, respectively. In this case the rounded seat count for each party is 1, 1, 1, 0, and 0. This totals three seats, but there are four seats to go around. We need the rounded seat count to have one seat more (4 - 3= 1).
5*, 6*, 7* and 8*)
Trying 1.5 as the constant does not work: rounding the resulting modified seat count results in the Liberal, Conservative, New Democratic, Green and Christian Heritage parties getting 2, 2, 1, 1 and 0 seats, respectively. That’s a total of six seats when there can only be four. The constant was too big, so we try something smaller: 1.35. This also doesn’t give results we want as there end up being five seats. Trying again with 1.2 as the constant does the trick. Multiplying each ideal seat count by the 1.2 gives the modified seat counts 1.79, 1.39, 1.16, 0.43 and 0.02 which round to 2, 1, 1, 0 and 0 for the proper total of four seats. So, in this example the final seat count would be 2, 1, 1, 0 and 0 for the Liberal, Conservative, New Democratic, Green and Christian Heritage parties, respectively.
These same results can be found using the first method described above (you can take a swing at calculating it that way if you like) and ensure that party overrepresentation and underrepresentation is minimized. A simple computer program can be used to pinpoint a suitable constant with ease.

Measuring Success
Each party's final seat count says how many of the remaining districts the party will represent. But, how exactly does PSD pair up each district with the party candidate that will be its representative? Before delving into how PSD manages this, let's first look at a couple guiding principles.
First, a party should represent the districts where it has its most successful results, not where it had weaker results. This principle is fairly noncontroversial and is actually assumed by the traditional First Past the Post system.
Second, if multiple parties lay claim to the same district, the district goes to the party with the more successful result there. This principle is necessary because only one candidate represents a district. (As a result of this, a party may sometimes represent a district where it had worse results than in a district that it does not represent, but this can only happen when the district it does not represent is represented by a party with even better results there.)
These principles mention more successful. What does that mean? More importantly, how can we measure that so results are objective and fair? We need a way to measure party's success in each district. Let's take a few stabs at that.
The first option that may come to mind is to just use a party's local vote count to compare its success between districts. This leads to problems with district sizes, though. For two districts with different populations and voter turnout, a raw vote count means different things, e.g. in two districts with 10,000 and 12,000 total votes, a party candidate getting 5500 votes is very different.
Comparing graphs A and B you can see that the exact same number of votes in different districts (in this case 5500 votes for two purple-party candidates) can have a different level of success.

Okay, take two. If raw vote count isn't a reliable way to measure local party success, how about comparing parties' proportion of votes in each district? Well... consider two candidates running for the same party in different districts (districts C and D), both receive 45% of the votes cast in their district. Who was more successful? If we use the proportion of the vote, we would conclude they did just as well. They didn't. The candidate in district C got 45% while his competitors got 54% and 1%. The candidate in district D also got 45%, but her competitors got 35% and 20%. The same proportion of the local vote can have very different levels of success.

Graphs C and D above show that the exact same proportion of votes in different districts (in this case 45% for two purple-party candidates) can have different levels of success.
Ughhhh, fine. Third time's the charm...A proportion of votes can be great, mediocre or terrible depending on the performance of competitors. More specifically, the success of a party candidate depends on the performance of its best local competitor. A party candidate with 30% of the local vote whose best local competitor has 20% is just as successful regardless of whether five other local candidates got 10% or ten other candidates both got 5%. Similarly, 30% is just as terrible for a party candidate whose best local competitor has 60%, regardless of whether one other candidate has 10% or two have 5%.


In E and F, the candidates for the purple-party beat their best competitor (the tan-party candidates) by a factor of 30:20 (i.e. 3:2). In G and H, the candidates for the purple-party perform terribly next to their best competitor (the tan-party candidates) by a factor of 30:60 (i.e. 1:2). In all four districts, the success of the purple-party candidates isn't affected by the performance of its worse competitors.
The simplest* means of comparing a party candidate's results to its best competitor is to create a ratio, the success ratio: (party candidate's proportion of district votes)/(best local competitor's proportion of district votes)
The result is a positive value: smaller numbers mean a less successful party candidate, larger numbers mean a more successful candidate.
The success ratio is calculated for every party candidate.
*If you really want you could use a different success measure. For instance, a success-proportion measure could use the success-ratio`s numerator but take the sum of the success-ratio’s numerator and denominator as its denominator (i.e. success-proportion: (party candidate's proportion of district votes)/(best local competitor's proportion of district votes + party candidate's proportion of district votes). Though a different measure of success could give seat distribution results that differ somewhat from the success-ratio`s, because all those measures need to quantify a given party’s results in a riding with respect to its best competitor there, they will generally give broadly similar results.
Let's see how success ratios work for the results in P.E.I. for the 2015 Canada federal election
The above chart gives the success ratios for all party candidates for P.E.I. in the 2015 Canada federal election.

Comparing Success between Parties
The success ratio is an excellent measure for comparing success of candidates in the same party, but there is one problem with it: it's not very good at comparing the success of candidates in different parties. Like majoritarian systems, the success ratio gives big parties an advantage while disadvantaging small parties with dispersed support.
A small party whose support is widely dispersed rather than concentrated in specific districts will necessarily have lower success-ratios than any big party, even if it has a large enough share of the popular vote to get some seats. Because of this, if seats are distributed to party candidates with the highest success ratios, district seats will be distributed to big parties first before any seats are distributed to the small, dispersed-support party. This means that the small party ends up representing whatever districts are leftover, with no regard for how well the party actually performed there. Remember the first guiding principle mentioned above: a party should represent districts where it has its best results, not just some random district. In order to give the smaller, dispersed-support party a chance to represent the districts of its best performing candidates, we have to modify the success ratio so that such a party's best results are comparable with those of big parties.
Our goal is achieved by comparing each success ratio with those of all the other candidates in the same party: for a specific candidate, subtract the average success ratio for her entire party from her success ratio and divide the result by the standard deviation* of the party's success ratios. Don't worry, a spreadsheet can handle all this in a snap.
*Standard deviation measures how spread out the success ratios are, a larger standard deviation, the more varied the party's success ratios.
The result is a new, inter-party comparable measure of success (hurrah), the success exceptionality measure. Success exceptionality shows how many of the standard deviations a success ratio is from the party average: any success ratio near the average for the candidate's party has a success exceptionality near 0, positive indicates better than average and negative is worse. The larger a success exceptionality value, the more exceptionally successful the candidate's results are for her party. With the success exceptionality measure, all candidates near their own party's average level of success are comparable and each party can get the seats for the districts of their best performing candidates.
Each candidate is ranked according to her success exceptionality value: from highest to lowest value, candidates are paired up with their local district. Once a district has a candidate to represent it, all other candidates from the district are removed. Once a party has received all its seats, its remaining candidates are all removed. The process goes until all parties have all their seats and all districts have a representative.
This process in no way changes the number of representatives for each party - that has already been determined by finding their final seat counts. This process ensures that each district is represented by a suitable candidate: a candidate that is among the best of her party, a candidate whose success in the district was the most exceptional.
Let's take a look again at the results in P.E.I. for the 2015 Canada federal election.
The chart above gives the success exceptionality values for each party candidate in P.E.I. in the 2015 federal election. The value for the Liberal candidate in Cardigan, for example, shows that the votes cast for him were 1.209312 standard deviations above the party average in P.E.I.. This is the best result for the Liberal party in P.E.I.. Only the Conservative candidate in Egmont had a more exceptionally successful result for her party.
The chart above shows how each party candidate in P.E.I. ranks with respect to their success exceptionality. Note that the Green and Christian Heritage parties are omitted because their support is too low to justify a seat in P.E.I. according to the seat count process. The most exceptionally successful is the Conservative candidate in Egmont, so she gets the seat for that district. Since the Conservatives only get one seat, the rest of their candidates cannot get a seat and are removed from the list. Also, because Egmont now has a representative, the Liberal and New Democratic candidates in that district cannot get a seat and are also removed from the list. The next most exceptionally successful candidate is the Liberal candidate in Cardigan, so he gets that seat and the other candidates in Cardigan are removed from the list. The New Democratic candidate is the next most exceptionally successful and so he gets the seat there, and the other candidates in the district are removed from the list. Since the New Democratic party only gets one seat, the rest of their candidates are removed as well. The next most exceptionally successful candidate is the New Democratic candidate in Egmont, BUT that district has a representative already and the New Democratic party already has all their P.E.I. seats, so we go to the next most exceptionally successful candidate, the Liberal candidate in Malpeque. With this candidate the Liberal party gets their second and final seat, and all districts have a representative. The seat distribution process is complete!


Ensuring Good Results
In most voter scenarios the PSD process provides maximally proportional results without any problems. There is a certain, though very rare, scenario where the process does not initially provide conclusive results.
When a party runs in only a few districts but its popular support requires multiple seats, it's possible that other parties are exceptionally successful in enough of those districts to leave too few seats available for the party there. As a result, the party is left with too few seats at the end of the PSD process: the party has no candidates in the only districts left without representatives.
To solve this problem and correct the party's seat deficit, compare the party's success exceptionality values in the districts where it ran candidates (but did not get the seat) with the value for the party candidates that did get the seats. The party makes up its seat deficit by getting the seats in those districts where it came closest to getting them in the first place. With these seats assigned to the initially seat-deficient party, the seat distribution process is redone to assign candidates to all the other districts and ensure all other parties get all their seats too. This seat deficit correction procedure preserves the party's seat count and the proportionality of results.
If all districts have a representative and all parties have their seats, the process is complete. Otherwise, if any party is left with too few seats and has no candidates in the remaining unrepresented districts, then the deficit correction procedure is repeated.
**Full disclosure - there is an even less likely, though technically possible, situation where a seat deficit cannot be corrected: when a party has a seat deficit, but all districts where it has candidates (but didn't get a seat) are represented by independent candidates. Because independent candidates only run in their one district, their seat cannot be redistributed without depriving them of a seat entirely. For this reason, the party is left with its deficit. The seats it is denied are redistributed to other parties with the seat counting process and then the seat distribution process is repeated. Though not ideal, the effect on the proportionality of the final results is limited. A single seat denied to a deserving party affects the party’s proportion of the elected body by 1/(total seats), e.g. in the 2015 Canada federal election there were 338 seats available, so each seat represents 1/338 which is 0.3%. Though physical restrictions may prevent a party from getting its ideal seat count, PSD ensures that results are as proportional as physically possible.
Thanks for sticking it out!
Yes, there are admittedly more than a few components to make PSD work. Hopefully you have some appreciation for why each component is necessary. Altogether, the little bits of PSD work to convert votes on simple ballots into maximally proportional representation without top-up seats and without bigger districts.
If you have any questions or comments, please let us know!