
Proportional Seat Distribution
Why PSD?
Voting System Options
How does Proportional Seat Distribution compare to other voting systems? This section looks at how some other voting systems work: First Past the Post (FPP), Alternative Vote (AV), List Proportional Representation (List PR), Mixed-Member Proportional (MMP), Single Transferable Vote (STV), Rural/Urban Proportional Representation (R/U-PR) and some proposed systems similar to Proportional Seat Distribution. These voting systems fall into two broad types: majoritarian and proportional.
Majoritarian versus Proportional Voting Systems
In majoritarian voting systems (such as FPP and AV) the candidate with more votes in a given electoral district is elected. Votes that don't support the winning candidate are not factored into the results - that can be over 50% of votes! As a result it is relatively easy for a political party to receive over half of all seats and form a majority government. As winners are solely determined at the level of the local electoral district, parties may get no seats if their support is too dispersed among many districts, and district boundaries can dramatically affect results.
Majoritarian systems work excellently when electing a candidate for a single position (such as a chairperson or president) in a single large district, and when electing candidates from many districts to form an assembly without party affiliation (such as councillors in party-free municipal politics).
Proportional systems (such as List PR, MMP, STV, R/U-PR and PSD) ensure every party's share of the elected body is close to their popular support. There are different ways to ensure a degree of proportionality in results such as extra top-up seats, multiple representatives in each district or proportional seat distribution. By keeping election results proportional, all votes cast for parties that get at least one seat directly affect the election outcome regardless of where the vote was cast and how many other supporters live nearby.
Proportional systems are excellent for electing candidates from many districts to form an assembly where party affiliation is important. By ensuring proportional representation of parties, these systems also prevent a party from getting most of the seats and forming a majority government when they do not have the support of the majority of voters.
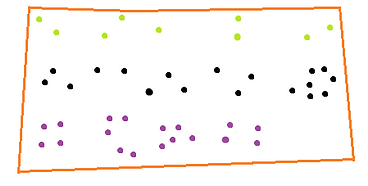
Let's look at how these two different types of voting systems handle vote results. Consider the following results from a region (bounded in orange) of five districts with 9 voters each:
Overall, the lime party has 9 supporters (20%), the black party has 18 supporters (40%) and the purple party has 18 supporters (40%). Majoritarian systems don't care about overall support - to see the election results for a majoritarian system we need the district boundaries. Below are two different ways that the region has been divided in the past:


A: lime - 1 seat
black - 3 seats
purple - 1 seat
B: lime - 0 seats
black - 1 seat (FPP) or 1-3* seats (AV)
purple - 4 seats (FPP) or 4-2* seats (AV)
*depending on voters' second choice
We see that majoritarian systems advantage some parties while disadvantaging others in ways that are not always predictable. Regardless of boundary lines and support in any single district, proportional systems ensure that each party gets about the same share of seats as their share of votes: lime would have 1 seat (20% of the seats), while black and purple would each have 2 seats (40% of the seats).
Voting Systems, Majority Governments and Minority Governments
Though both majoritarian and proportional voting systems can result in majority and minority governments, majority governments are relatively more common with majoritarian systems while minority governments are relatively more common with proportional systems: by providing advantage to some parties, majoritarian voting systems make it relatively easy for an advantaged party to receive over half the seats without the support of over half the voters; but with proportional voting systems, the only way for a party to form a majority government is if over half the voters actually express support for it. Because majoritarian systems make formation of majority governments easier while proportional systems do not, it is important to understand the differences between how majority and minority governments rule.
Since all majority governments have over half the seats in their legislature, they are guaranteed to have the necessary votes to implement most any legislation they desire (depending on party control, abstentions and if there are any procedures that require more than a simple majority to pass). Because their power to pass legislation is all but assured, majority governments tend to share certain common features: they rule for the entirety of their term; they rule without having to consider the opinions of other parties; and, being unable to affect legislation, the non-governing parties take up an adversarial stance, not offering suggestions and constructive criticism so much as insisting they could rule better. Furthermore, in a majoritarian system, if a party achieves a majority government for a term with support from a minority of voters, a relatively small shift in voter preference at the next election can bring a different party into power as majority government, able to rule as it sees fit. Such a great shift in government has significant effects for the public: as goals and governing style shift, government agencies suffer from instability in policy, purpose, and job security, and previous legislation may be repealed for partisan reasons. These changes have budgetary consequences, especially since government control can ping-pong endlessly between parties implementing, repealing, and re-implementing their pet legislation and policies.
When no party has over half the seats in legislature, a majority government cannot be formed -- the party that gets to rule requires additional votes to pass legislation and so must consider the views of other parties. Minority governments have to listen to their peers across the aisle and work together to create laws that are acceptable to wider variety of representatives (and voters), either on a case-by-case basis or by making a formal coalition with some other parties. If a minority government tries to rule without regard to others, they can be voted down, losing their position as government and forcing a new election. So, while minority governments can be less stable than majority governments, the potential to lose their position of power during their term holds them accountable, but majority governments can only be brought to account at the end of their term. In contrast, legislation of a majority government can be less stable than a cooperative minority government's.
First Past the Post
First Past the Post (FPP) is a majoritarian voting system. It was the most common voting system historically and continues to be used in Canada federally and provincially. With this system every district gets a single representative. During an election, voters mark a single X next to their candidate. The representative is the candidate who gets more votes than anyone else in the district. In districts with many candidates the winner may receive far less than 50% of the votes.
FPP's wide use in the past is due to it being conceptually simple. It has fallen out of favour in many parts of the world because of the bizarre outcomes it can generate. In general, FPP disproportionately helps big parties while hurting parties with smaller, dispersed support. This encourages parties to merge to gain the big-party advantage. Because FPP tends to amplify the support for big parties, a small shift in voter support between big parties often leads to huge changes in representation. The result is pendulum/yo-yo/whiplash/see-saw governance where a few big parties take turns benefiting from FPP to form a majority government, reversing the previous government's policies despite just a minor change in votes.
Some specific scenarios that can arise from FPP:
a) in a three-party system, as little as 34% of the total votes can give one party all the seats (with more parties the share of total votes needed for this can be even lower)
b) a party can receive as much as 49% of the total votes and still get no seats
c) the party with the largest share of the total votes can get less than 50% of the seats while another party with fewer votes gets more than 50% of the seats and forms a majority government. This has actually happened in Canada: federally in 1896 and provincially in 1986 (Saskatchewan) and 1996 (British Columbia).
Alternative Vote
Alternative Vote (AV) is a majoritarian system. Like FPP, every district gets a single representative. Unlike FPP, voters can rank the candidates on their ballot, writing in numbers to identify their first choice candidate, second choice candidate, third choice candidate, and so on. To determine the winner in a district, each voter's first choice candidate is considered. If a candidate has over 50% of the district's first choice votes, she is elected. If no candidate has over 50% of the first choice votes, the candidate with the fewest first-choice votes is then taken out of the running and anyone who voted for that candidate has their vote given to their next choice, if they have one. With votes newly redistributed, if any candidate has over 50% of the votes then she is elected, otherwise the process continues until a candidate does get some level of support from over 50% of the votes.
By making use of voter's alternative choices, this system ensures that the amount of votes from a district that do not directly influence the result is always less than 50%. Compared to FPP, AV can then make more voters feel they had an effect, though many of the winning candidate's supporters may still not have preferred her.
As a majoritarian system, AV tends to disadvantage parties with smaller, dispersed support - their votes tend to be redistributed to candidates with more locally concentrated support. As a result AV tends to give results even less proportional to the total vote than FPP. AV also tends to advantage parties seen as a more moderate choice between extremes, since supporters of one extreme party would tend to rank a moderate party better than a party seen as the opposite extreme.
List Proportional Representation
List Proportional Representation (List PR) is a proportional voting system. Voters mark an X on the ballot for their party (an independent candidate is treated as a one-person party) and the support for each party is used to determine how many seats each party gets: 40% of votes in a region means about 40% of seats in the region. Voters may be given the option of choosing the specific party candidate they prefer for their region from a list of the party's candidates on their ballot. This is called Open List Proportional Representation. With Closed List Proportional Representation, voters choose only their party on their (much emptier looking) ballot and the party decides who will be their representatives.
List PR maximizes proportionality for each region: the more representatives in a region, the more proportional the results. To allow for many representatives in a region, the region needs to be pretty big. The most proportional option for List PR is a single region for all representatives. List PR gets rid of local electoral districts to ensure party proportional results,so representatives may be disconnected from voters' local concerns.
Mixed-Member Proportional
Mixed-Member Proportional (MMP) is a hybrid proportional system. MMP combines the FPP system with top-up seats used to bring party representation in line with their popular support. Like FPP, every electoral district has a single representative. Voters indicate their preferred local candidate and preferred party on their ballot. There are two types of ballots that can be used with MMP: one-X ballots and two-X ballots. On one-X ballots voters mark a single X next to their local candidate, indicating that they support the specific candidate as well as her affiliated party. On two-X ballots voters mark an X for their local candidate in one section of the ballot and mark an X to indicate their top-up seat preference in another section. The top-up seat section of the two-X ballot may be a closed list (meaning voters indicate their preferred party, but it is the party that decides who will occupy its top-up seats) or an open list (meaning voters select an actual candidate that they support for a top-up seat). Top-up seats are determined by looking at the overall regional support for each party and calculating how many seats are needed, in addition to the local representative seats, so that the party's share of all seats (local representative and top-up) is as close as possible to its support. Voters whose preferred local representative does not get the local seat still directly affect results by contributing to party representation with their the top-up vote.
The degree of proportionality resulting from MMP depends on the amount of top-up seats: more top-up seats mean results will be more proportional more often. To allow for top-up seats there have to be more representatives in the elected body or fewer local representatives with fewer, larger electoral districts.
Single Transferable Vote
Single Transferable Vote (STV) is a proportional system. In this system every electoral district has multiple representatives. Voters rank the local candidates on their ballot. When the votes for a candidate exceed a specific quota, the candidate gets a seat in the district. If not all seats are full, the candidate with the fewest first-choice votes is removed and their votes are redistributed according to the voters' next choice. If a candidate then meets the required quota, she gets a seat and if there are still empty seats, the process continues.
The proportionality of STV results depends on the number of representatives in an electoral district: more representatives, the more proportional the results tend to be. Having many representatives in each electoral district essentially nullifies the advantage that ranked voting gives to moderate parties in single-member districts (unlike with Alternative Vote). To allow for many representatives in each electoral district there needs to be many times more representatives than in an elected body with single-representative districts or there needs to be much fewer, much larger electoral districts.
Rural/Urban Proportional Representation
Rural/Urban Proportional Representation (R/U-PR) is a hybrid proportional system - it creates proportional results by mixing together elements from different systems. It combines a variety of voting systems for the purpose of keeping electoral districts reasonably small but without requiring many additional representatives. The need to manage district size is particularly important for vast countries like Canada where geographical considerations are an issue. With R/U-PR, rural electoral districts (the largest districts by size) use FPP or AV to elect a single local representative. Urban electoral districts (small in size) are grouped together to form larger districts with multiple representatives. The representatives in the large urban districts are elected by List PR or STV. The final piece of R/U-PR is MMP-style top-up seats which everyone (rural and urban voters) decide by marking an X for their preferred party on their ballot. The different components of this system work together: single-representative rural districts prevent the big districts from getting bigger; the top-up seats ensure proportional results despite any advantages given to parties in the rural and urban districts; and the multi-representative urban districts provide a degree of proportionality which makes the final results more proportional with fewer top-up seats.
Though R/U-PR offers a greater level of proportionality than MMP does, the degree of proportionality still depends on the amount of top-up seats and the number of representatives in the multi-representative urban districts: more top-up seats and more representatives in an urban district mean results will be more proportional more often.
Proportional Seat Distribution
Proportional Seat Distribution (PSD) is a proportional system. PSD preserves electoral district boundaries, ensuring each district has a representative. In an election, voters mark a single X for their candidate on their ballot. Independent candidates get a seat if they have the best results in their riding, but parties get seats based on their overall support in the wider region (i.e. in the country, or province/territory, or cluster of multiple neighbouring electoral districts). Electoral districts represented by a party are distributed to the candidate with the best (technically, with the most exceptionally successful) results in the district and each party's best candidates get a seat.
PSD minimizes the number of votes that do not contribute to the election of representatives and provides proportional results with no big-party advantage, no moderate-party bias and no need for more representatives, bigger ridings nor complex ballots.
Proposed Systems Similar to Proportional Seat Distribution
Proportional Seat Distribution (PSD) is not the only voting system designed to ensure that electoral district boundaries are preserved and that each political party has seats in proportion to their share of votes without the use of top-up seats. Here are three similar systems, along with links for additional information on them:
Single Member District Proportional Representation (SMDPR) by Denis Falvey, Peter Black, Matt Riser and John Trent
Ordered Proportional Representation (OPR) by Benjamin Trister and Rachel Trister
Fair Majority Voting (FMV) by Michel Balinski
(http://www.mathaware.org/mam/08/EliminateGerrymandering.pdf)
Like PSD, these voting systems calculate how many seats each party receives based on the party’s share of votes cast and they then determine which party's candidates will represent which electoral district. These systems do differ from PSD in some important ways: none use the Webster/Sainte-Laguë highest averages method* to count each party’s seats (so they do not ensure that party overrepresentation and underrepresentation are minimized) and none use the success ratio‡ to rank the success of party candidates.
*SMDPR does not advocate a specific method for counting party seats. OPR uses the Hare largest remainder method. FMV uses the Jefferson/d’Hondt highest averages method and thus only minimizes party overrepresentation.
‡SMDPR uses candidates’ raw vote totals or their proportion of votes in their electoral district. OPR uses candidates’ proportion of votes in their electoral district. Technically, FMV does not assign a ranking to a party’s candidates at all. Instead, it compares all the feasible combinations of parties representing electoral districts in order to determine which combination has the greatest geometric mean of the votes cast for elected candidates. While FMV has much to recommend it, its computational intensiveness may make it impractical in situations where there are multiple strong parties or many electoral districts.
Comparison Chart
* PSD can be applied everywhere together (i.e. the entire country is treated as a single region) or to different regions separately.
‡ The Gallagher Index and Gallagher Index Composite measure the overall proportionality of an election: lower values indicate more proportional results, higher values are less proportional. The values here come from the results for each voting system when applied to the 2015 Canada Federal election. As the proportionality of proportional systems depends on the number of top-up seats and number of seats in a district or region, the values for the proportional systems are not definitive. The values for FPP, AV, MMP, STV and R/U-PR are taken from Byron Weber Becker’s brief as submitted to Canada’s Special Committee on Electoral Reform on September 30, 2016. It is available at http://www.parl.gc.ca/Content/HOC/Committee/421/ERRE/Brief/BR8454480/br-external/BeckerByronWeber-e.pdf
¤ The Gallagher Index Composite measures the proportionality of election results in each region (in this case, each province and territory in Canada), unlike the regular Gallagher Index which under-reports regional disproportionality when offset by results elsewhere.
